Thursday, 28 July 2022

Normal Distribution (Ordinates method)


 FITTING OF NORMAL DISTRIBUTION (ORDINATES METHOD)


1.   1. Fit a normal distribution for the following data by ordinates method 

Class

150-160

160-170

170-180

180-190

190-200

200-210

210-220

220-230

230-240

Frequency

9

24

51

66

72

48

21

6

3


2.   2. Fit a normal distribution for the following data by ordinates method  


Class

30-40

40-50

50-60

60-70

70-80

80-90

90-100

100-110

110-120

Frequency

5

4

3

8

7

10

4

3

2


Normal Distribution (Areas method)


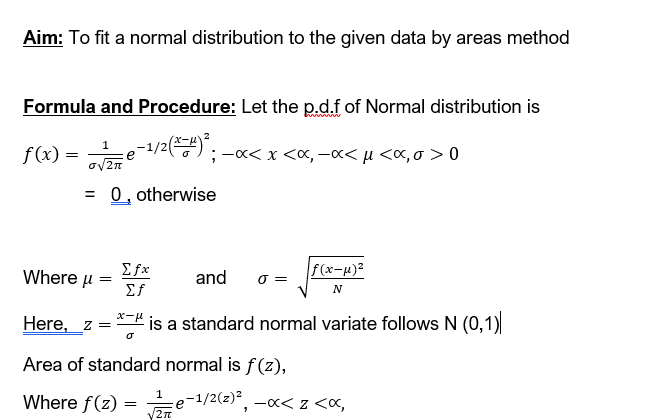
FITTING OF NORMAL DISTRIBUTION (AREAS METHOD)


Fi 1. Normal Distribution to the following data by Areas method 


Class

60-65

65-70

70-75

75-80

80-85

85-90

90-95

95-100

Frequency

3

21

150

335

326

135

26

4


2.         2.  Fit a Normal Distribution to the following data by Areas method

Class

0-10

10-20

20-30

30-40

40-50

50-60

60-70

70-80

80-90

90-100

Frequency

3

16

50

100

132

110

60

22

6

1


Sunday, 24 July 2022

Completely Randomized Design (CRD)


 COMPLETELY RANDOMIZED DESIGN


1. A Set Of Data Involving Four Tropical Feed Stuffs A, B, C And D Tried To 20 Chicks Are Treated Alike In All Respects Except The Feeding Treatments and each feeding treatment is given to 5 chicks. Analyse the data.

Feed

Gain in Weight

A

55

49

42

21

52

B

61

112

30

89

63

C

42

97

81

95

92

D

169

137

169

85

154


2. For testing the variety effect in a completely randomized experiment, the data (the yield of barley in grams) are as shown in the following table. Perform the analysis of variance.

320

V1

340

V4

398

V5

360

V4

350

V3

372

V2

455

V2

417

V3

420

V1

358

V5

400

V3

353

V1

334

V5

331

V1

358

V4

370

V4

340

V5

375

V2

320

V5

325

V3

430

V5

358

V1

378

V3

395

V4

328

V2

383

V2

275

V3

375

V4

308

V2

400

V1

Sunday, 17 July 2022

ANOVA (Two-Way)


TWO-WAY CLASSIFICATION OF ANOVA


1. The following table gives the wheat yield in bushels per acre of 4 varieties grown in 5 blocks. Test the mean yield of these varieties or block differ significantly. F(3,16). 5% = 3.04


2. Data about the number of units produced per day turned out by 4 different workers using 5 different types of machines are: 


On the basis of the information, can it be conclude that:

a). the mean productivity is the same for different types of machines?

b). the workers do not differ as far as their productivity concerned?

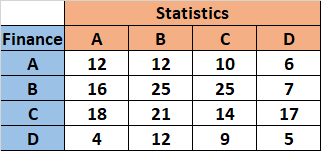
3. The performance of a class of 200 students in the subjects of statistics and finance was graded into four classes A, B, C and D. The below table indicates number of students by grades in each of two subjects. Test at significance levels of 5% whether the performance can be inferred as independent. 


Thursday, 14 July 2022

ANOVA (One-way)


ONE WAY CLASSIFICATION OF ANALYSIS OF VARIANCE


1. The following table gives the retail prices of a commodity in some shops selected at random in         four cities. Carry out the analysis of variance to test the significance of the difference between the price of commodity in four cities. 


2. Four machines produce steel wire. The following data give the diameters at ten positions along the wire for each machine. Examine by performing the analysis of variance , whether the machine means can be regraded as constant.


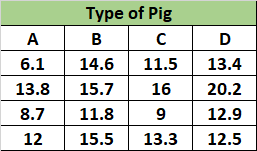
3. Sample of pigs of each of four types were fed on the same ration over a period. The figures in the table denote increase in weight in lb. per pig at the end of the period. Do the sample means differ significantly.


Saturday, 5 March 2022

Life Tables

 Practical Exercise - 8

Construction of Life Table


1. Complete the life of the population of a certain types of insects, x being the age in days and lx=1000       for   x=0


2. Given the following table for lx, the number of rabbits living at age x, complete the life table


3. Fill in the blanks in a portion of life table given below


Tuesday, 22 February 2022

Mortality and Fertility Rates

 Practical Exercise - 6

Computation of Various Mortality, Fertility  Rates

1. Compute Crude and Standardized death rates of the two regions on the basis of given data and also             calculate  standardized death rates


2. Compute Crude and Standardized death rates of the two regions on the basis of given data and also         calculate  standardized death rates (hint: Consider A- region  population as standard population)


3. From the following data, calculate crude accident rates of the two factories A and B and also corrected accident rate of B taking A as the standard. 


4. Compute CBR, GFR, SFR and TFR from the given data.


5. Calculate CBR, GFR, SFR and TFR from the given data.


Fitting of Exponential Distribution

  GAYATRI VIDYA PARISHAD COLLEGE FOR DEGREE AND P.G. COURSES (S) PRACTICAL EXERCISE - 9 FITTING OF EXPONENTIAL DISTRIBUTION 1. Fit exponenti...